LUMIERE ANALYTICS
The Lumiere Dashboard

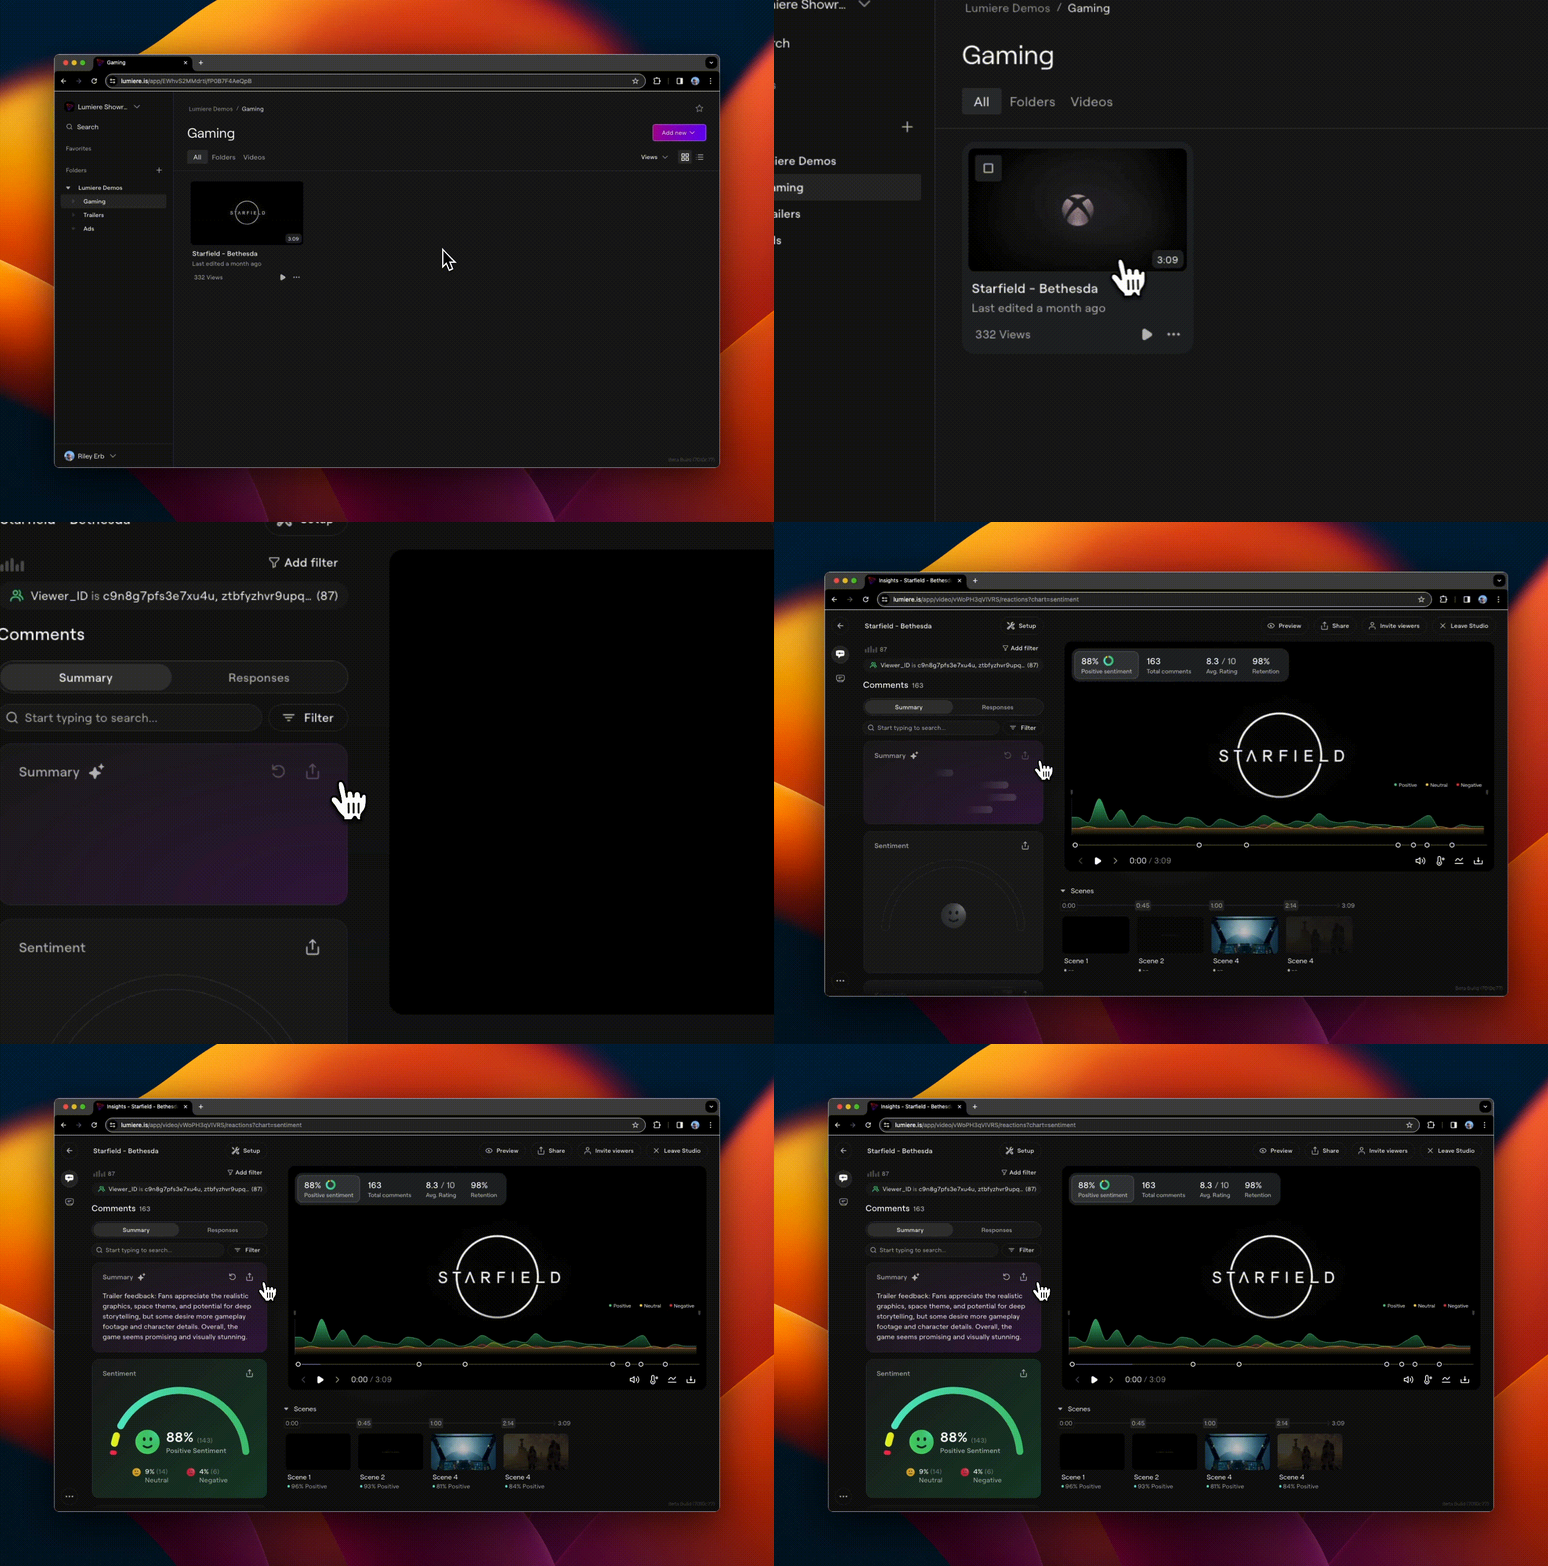
Your dashboard delivers more than just numbers. Lumiere uncovers deep insights on your audiences.
Vivid data, granular insights

All the Insights in One Place
Lumiere creates dashboard views from in-the-moment reactions, prompted questions, and a variety of other valuable inputs.
Heat maps, sentiment charts, and word clouds help to bring your data to life.

Hypergranular Visuals
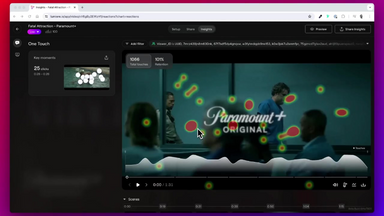
Get clear visualizations on the key moments generating the most viewer feedback.
Zoom in on reactions at any moment or location on-screen to understand what audiences are thinking. Zoom out to reveal larger patterns.

Complex Data Made Easy
Lumiere's feedback modes help you get beyond surface level responses and reactions from viewers.
Our intelligent dashboard is able to organize all the data into coherent summaries for every study you run.
Can I output the data from my Lumiere study?
Yes! Easily output small data sections or entire summaries.
Lumiere allows you to output and share data and insight summaries from your studies in many different formats including:
- Team access to the study's interactive dashboard
- PNG files with layered options of different data mode recordings to chose from
- Gifs of key moments
- CSV files of data
What if I need additional research support?
Lumiere was built to make video testing easy. We also know that there may be times where your team has more complex projects that require additional support.
For projects where you need something outside of the testing capabilities of Lumiere, the Latitude research team are your expert research partners. We will advise and build your more complex projects to meet your enhanced specs and requirements.

